slope-field [](https://github.com/open-source-society/data-science)
- dy/dx: derivative of the function you are trying to visualize
- range: range of numbers to draw
- estimation size: size of `deltax` which is used to draw the slope corresponding to a small point, `0.03` is usually a good number, but you might want to try out larger numbers to get a more detailed picture on some examples
```
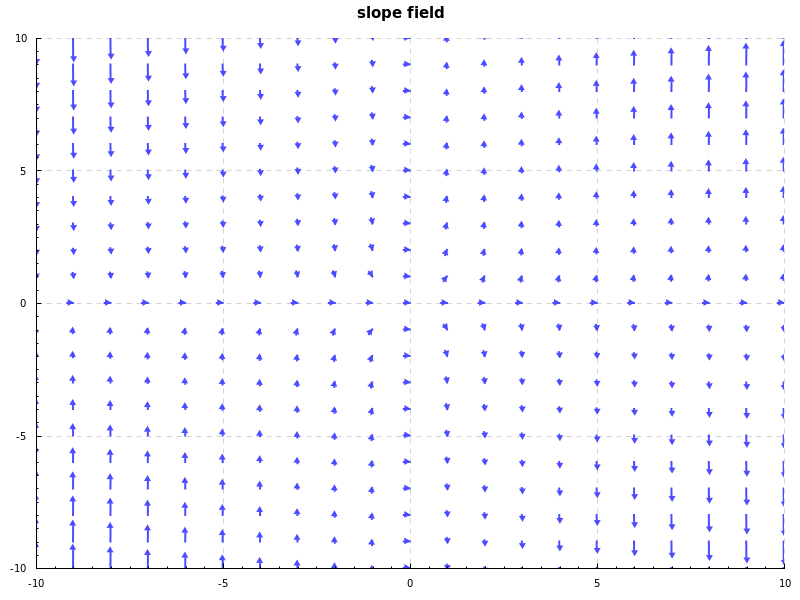
dy/dx =
x + y
range - format: (lower, upper):
(-10, 10)
estimation size:
0.03
```

```
dy/dx =
x * y
range - format: (lower, upper):
(-10, 10)
estimation size:
0.03
```